Sketch 01
WITCHCRAFT!
| Assigned | Due | Submit |
|---|---|---|
9/14/26 |
9/21/26 |
Section 1, Section 2 |
Context
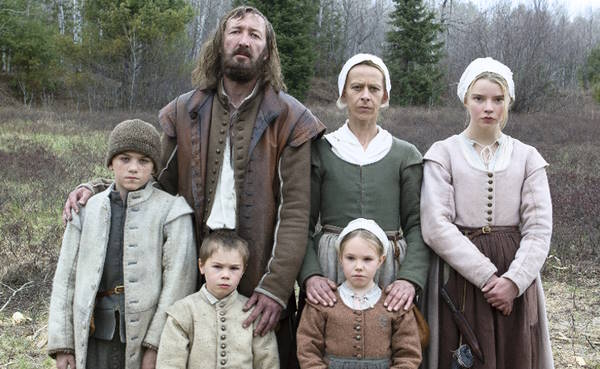
“The goat is loose again, William!” cries your wife from across the hall. Not again, you think. In your rush to stand up, you knock over a jar of pickled herring. The air is pierced twice: first, when the glass breaks, and then again, a moment later, when the baby, sweet Samuel, begins to wail. There will be hell to pay for that later, but for now, you have a goat to catch.
I’ve got bad news: you are a 17th century peasant farmer. Between chasing down your shank of a goat and feuding with the neighbors (they are heretics), you barely have time to think about how much your life has really sucked lately. Your wife Katherine, teenage daughter Thomasin, preteen son Caleb, and young fraternal twins Mercy and Jonas were recently banished from a nearby settlement over a religious dispute. One day, after your newborn son Samuel suddenly disappears while under Thomasin’s care, you begin to suspect there is something dangerous lurking in the secluded woods near your farm, and …
… whoops. Sorry, I got a little mixed up. That’s the plot to critically acclaimed film The VVitch (Robert Eggers 2016), not instructions for this week’s assignment. But hear me out! While this week’s assignment doesn’t deal with disappearing infants or fugitive livestock, it does deal with witches—and I will need you to occupy the headspace of a 17th century peasant while you work on it.
During the early modern period, thousands of people were accused of being witches during a global social panic around witchcraft. Today, we know this panic as the “witch trials.” The famous Salem witch trials were small compared to the similar panics in England and Scotland around the same time. Indeed, just between 1661 and 1662, four times as many people were accused of witchcraft in Scotland than during the Salem witch trials (Levack 1980, 90–91).
There are all sorts of reasons to study the witch trials. One reason, as argued by the feminist political economist Silvia Federici, is to trace the rise of capitalism through state-sanctioned reproductive discipline. In Caliban and the Witch, Federici argues that the global population crises caused by imperial expansion in the 16th and 17th centuries corresponded with a deepening control over women’s reproductive labor by the capital-s State. By analyzing the witch hunts of the 16th and 17th centuries as wars waged against women’s bodies, Federici shows us how the development of property and labor markets in early modern Europe also “demonized any form of birth-control and non-procreative sexuality” (Federici 1975, 88). She elaborates on this concept in a newer collection of essays, Witches, Witch-hunting, and Women (Federici 2018).
Optionally, listen to this short podcast interview with Silvia Federici (Bose 2023) about her newer book.
You’ll be required to include a primary or secondary source in your maps this week, and this podcast would suffice.
Witchcraft cartography
In this week’s assignment, you must imagine you are a Scottish mapmaker who has been collecting data on witchcraft accusations accross the country.
Your reputation as a cartographer precedes you such that two separate clients—Agnes and Craig—recently approached you to make two different maps. Agnes is terribly afraid of the witch problem and wants a map that warns her neighbors of the problem, while Craig is not worried at all about witchcraft and considers the whole witch thing overblown.


Using your knowledge of cartographic best practices, data classification, and visual argumentation, you will create a pair of maps that will use the same data to tell different stories about the Scottish witch trials:
| Map for Agnes | Map for Craig |
|---|---|
| Convey that witches are a serious problem on the rise | Calm our nerves, insist there’s really nothing to worry about |
It’s easy enough to spatialize witchcraft spreadsheet data using ArcGIS Pro. The question is, how will you visualize it differently for each client?
Follow these steps to get started…
Step 0: Workspace
First, create a workspace. Create a sensible directory for this assignment, and when you download your data, name the files well.
Step 1: Download
Now, download the required datasets, all of which must be included in your final maps:
- Accused witches in the Scottish witch trials—the original data is from is from here
- Scotland’s civil parishes in 1930—unfold “Civil Parish Dataset” and download the ZIP file
- Land and water features from Natural Earth will be useful for composing your base map
Don’t forget to unzip the civil parishes before loading them into ArcGIS Pro.
Step 2: Join
You have two pieces of data—a descriptive, tabular dataset of witchcraft accusations, and a spatial, vector dataset of civil parishes in 1930—but they’re not connected yet. A table join will help you connect them. Table joins are a critical tool in the geospatial toolkit. They combine descriptive tabular information with geospatial data based on a common field.
To create a table join:
- Load your two layers into an ArcGIS Pro project—that is, the civil parishes
shpand the witchcraft accusationsxlsx - Open the Add Join geoprocessing tool
- Find a “common field,” or a field that exists in both tables that you could use to crosswalk different parishes to different counts of witchcraft accusations
If you get stuck with this, check out Esri’s documentation on table joins. We’ll do more with joins next week.
Step 3: Classify
When the data is joined, you will be able to apply symbology for civil parishes of Scotland based on the count field from the witchcraft spreadsheet. This is a chance for you to experiment with different kinds of classification methods. Which classification methods could you use to more effectively get your argument across, depending on your audience?
Step 4: Design
Create two maps that meet the requirements identified below. Consider the following:
- You can convert your legend to a graphic for easier legend handling
- Check out Esri’s other tips on ArcGIS Pro layouts
- Use rulers and guides to ensure consistency between your two maps
Step 5: Report
Don’t forget to write a paragraph-length (no more than 100 words) “client report” for each map you make. The report should be addressed to the client—e.g., either Agnes or Craig—and it should clarify:
- How your design choices (e.g., title, color) help bolster the map’s argument
- How your classification choices (e.g., graduated vs. categorical representation, jenks vs. equal interval) help bolster the map’s argument
Requirements
Things your map must include
The following items are required for both maps you submit:
- A homemade basemap. For this assignment, you may not use a standard ArcGIS Pro basemap!
- A title
- A legend
- Some sort of inset map
- Accused witches by parish, sensibly represented for the client
- Some kind of “propogandistic” accompanying text
- Labels (at your discretion)
- A primary or secondary source (image, text, etc.) about the Scottish witch trials (HathiTrust and Internet Archive are good places to start)
Optionally, you could include things like:
- a scale bar
- a north arrow
- other cartographic accoutrement
Things I’ll dock you points for
- Inappropriate projections (examples of inappropriate projected coordinate systems for Scotland include WGS 84, Mercator, and Plate carée)
- Parishes with “no data” using the same symbology as areas with
0values - Including a pre-made basemap
- “Data speak” in your legend—e.g., titles like
accused_witches_scotland
Things you should consider when making your map
- How to use color to convey meaning
- What kind of font and font placements are useful for getting your message across
- How you can use scale to bolster your argument
- Which classification schemes will help get your points across
Examples
Before you start working on this assignment, check out this pair of maps that Daniel Huffman created for the Leventhal Map & Education Center. Using the same exact datasets of free wi-fi locations and household internet subscription rates in Boston, Daniel makes two opposite arguments.


Here’s a similar example, also created for the same Leventhal Center exhibition, which draw on data about health issues and hazardous sites across Massachusetts:
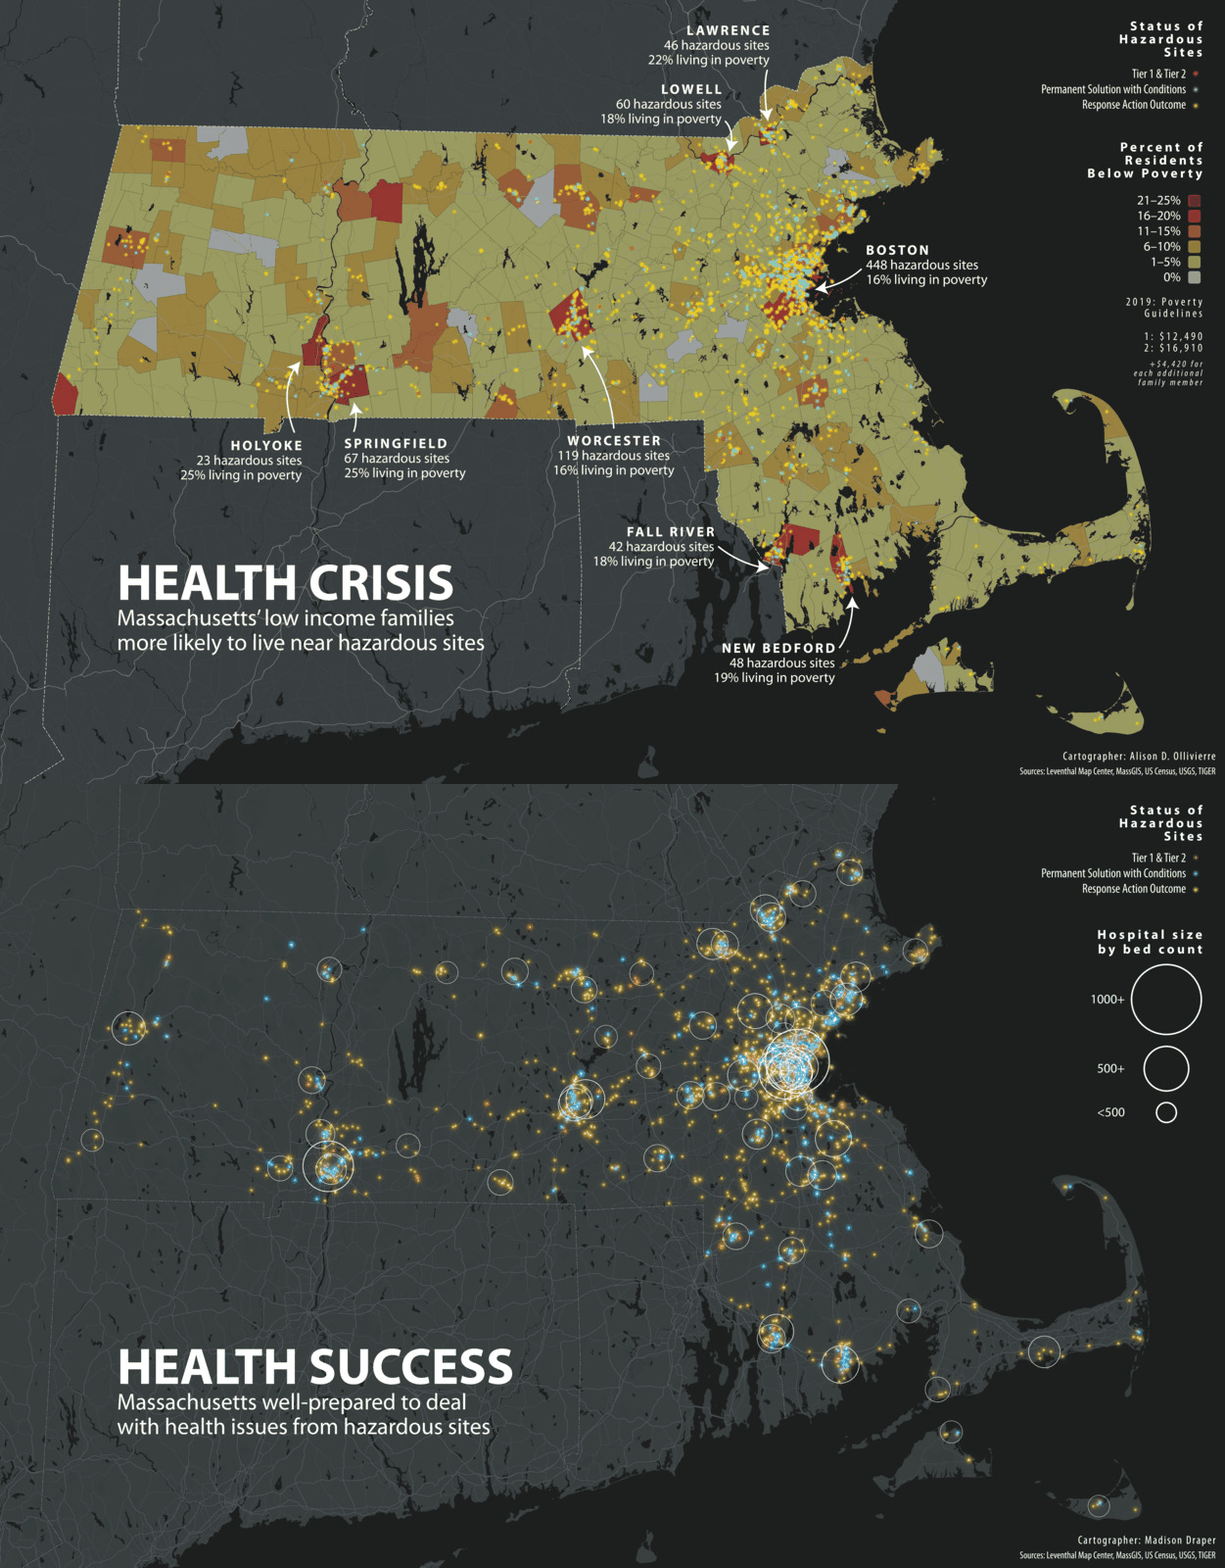
I encourage you to look through these additional examples of similar maps from the Leventhal Map & Education Center. Also, Cornell has an amazing collection of “persuasive maps” in the P.J. Mode Collection, which may provide sources of inspiration.
You should feel empowered to borrow liberally from the styles, techniques, and tropes that these mapmakers used. Imitation is the sincerest form of flattery (as long as it isn’t plagiarism).
Submission details
| Assigned | Due | Submit |
|---|---|---|
9/14/26 |
9/21/26 |
Section 1, Section 2 |
By 11:59pm on 9/21/26, submit the following to Canvas:
- Two maps, exported in
pngformat at 300 DPI, following the instructions above - A client report for each map, submitted in
docxorpdf(these can be submitted in the same document)