Final project
| Assigned | Due | Submit |
|---|---|---|
10/5/26 |
12/7/26 |
Section 1, Section 2 |
Submission schedule
Note the following deadlines associated with final project coursework:
| Benchmark | Due |
|---|---|
| 1: Project pitch | 10/19/26 |
| 2: Meet with Ian | 11/4/26 |
| 3: Draft map and reflection | 11/18/26 |
| 4: Printing your final project poster | 12/10/26 |
| 5: Project expo | 12/11/26 |
Overview
The final project is an opportunity to collect, process, analyze, and visualize spatial data of your own choosing. You must choose a topic and elaborate it in four registers: topical, conceptual, technical, and graphical. These are explained below. Plainly, I like to think of them as your final project’s “what, why, how, and whoa” factors.
Spread across about seven weeks of work, your final product will culminate in a large-format infographic that describes the research question, data, and methods as well as the analysis and the results. So long as your infographic engages with all of these points, it could take whatever format you like (e.g., it need not be designed as a traditional, symposium-style poster). Alternatively, you may propose another kind of creative work which draws substantively on course concepts and geospatial analysis methods.
All final projects are due to Canvas by 11:59pm on Monday, 12/7/26.
Final project poster expo
In lieu of a final exam, we’ll meet for a final project expo, scheduled during your final exam block: Friday, 12/11/26 at 9am for Section 02 (1:30-2:45pm class), and Monday, 12/14/26 at 9am for Section 01 (12:00-1:15pm class).
Printing your final project poster
You are responsible for printing your poster at the Weinstein Technology Center. You MUST book a time to print your poster by Wednesday, 10/14 at the absolute latest. Your chosen time must be between Monday, 12/7 and Friday, 12/11, and note that you have to print your poster before the scheduled final exam period for your section. This means thoses of you in Section 2 cannot print on Friday, 12/11 (because that is your exam period). Additionally, to balance the WTC’s busy printing schedule during finals week, I ask that those of you in Section 1 avoid printing on Monday/Tuesday, if possible.
Examples
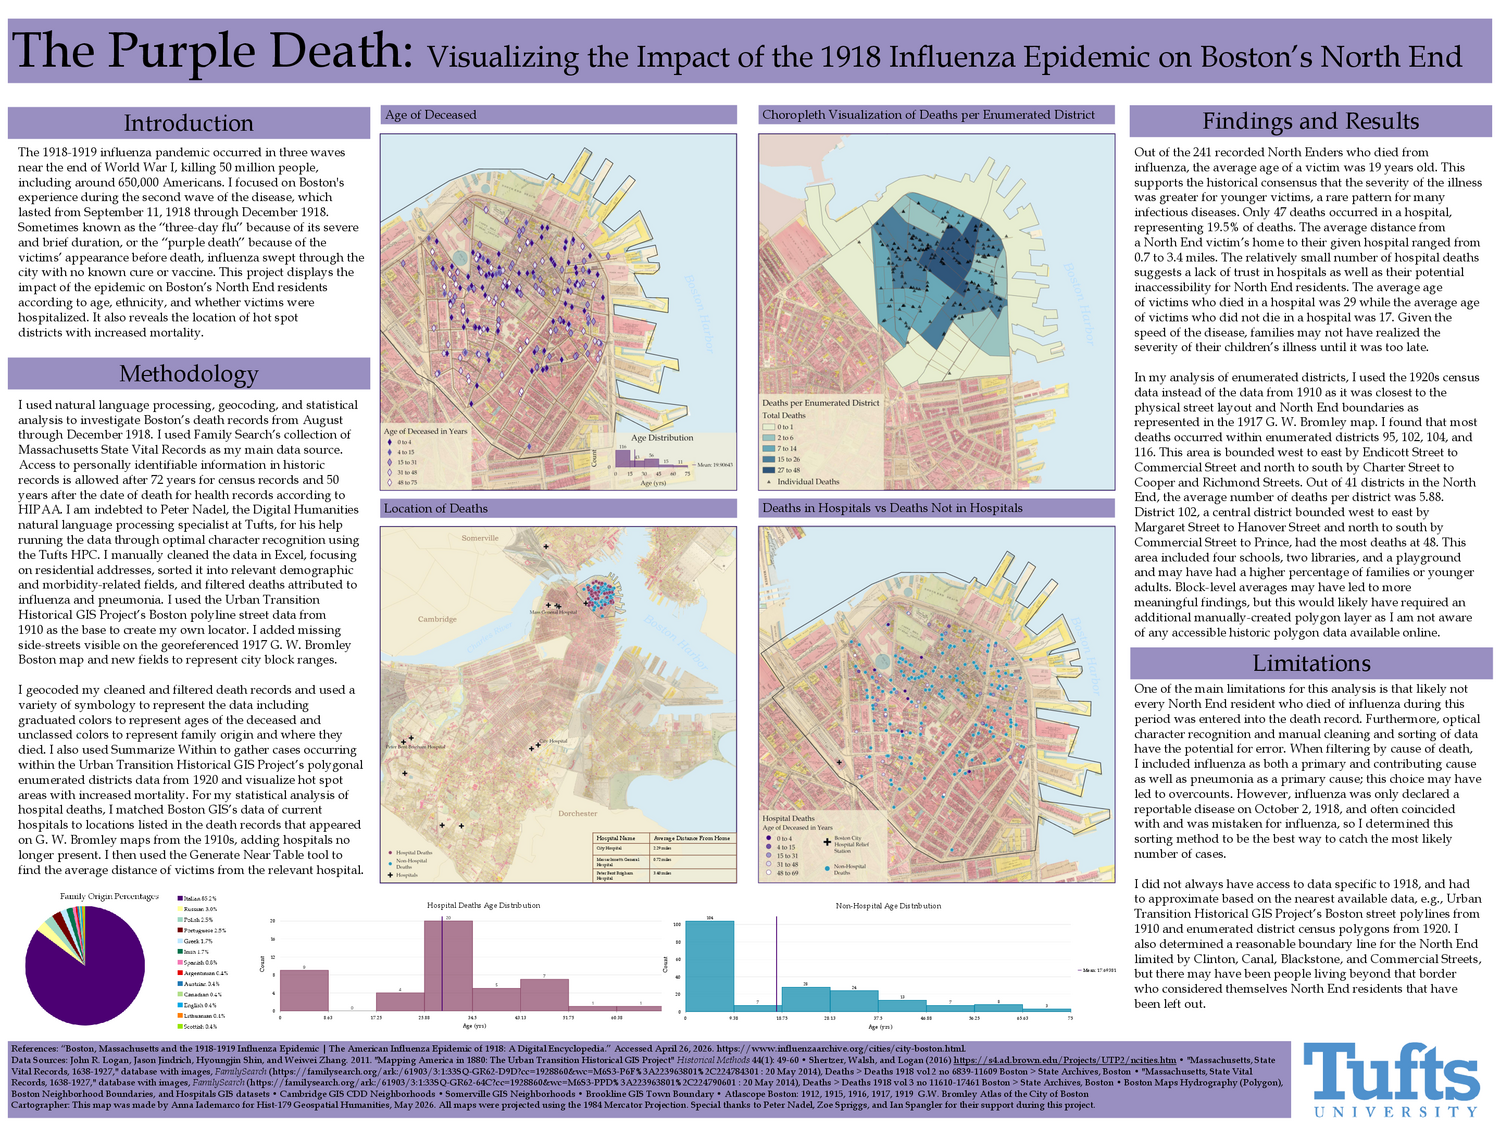
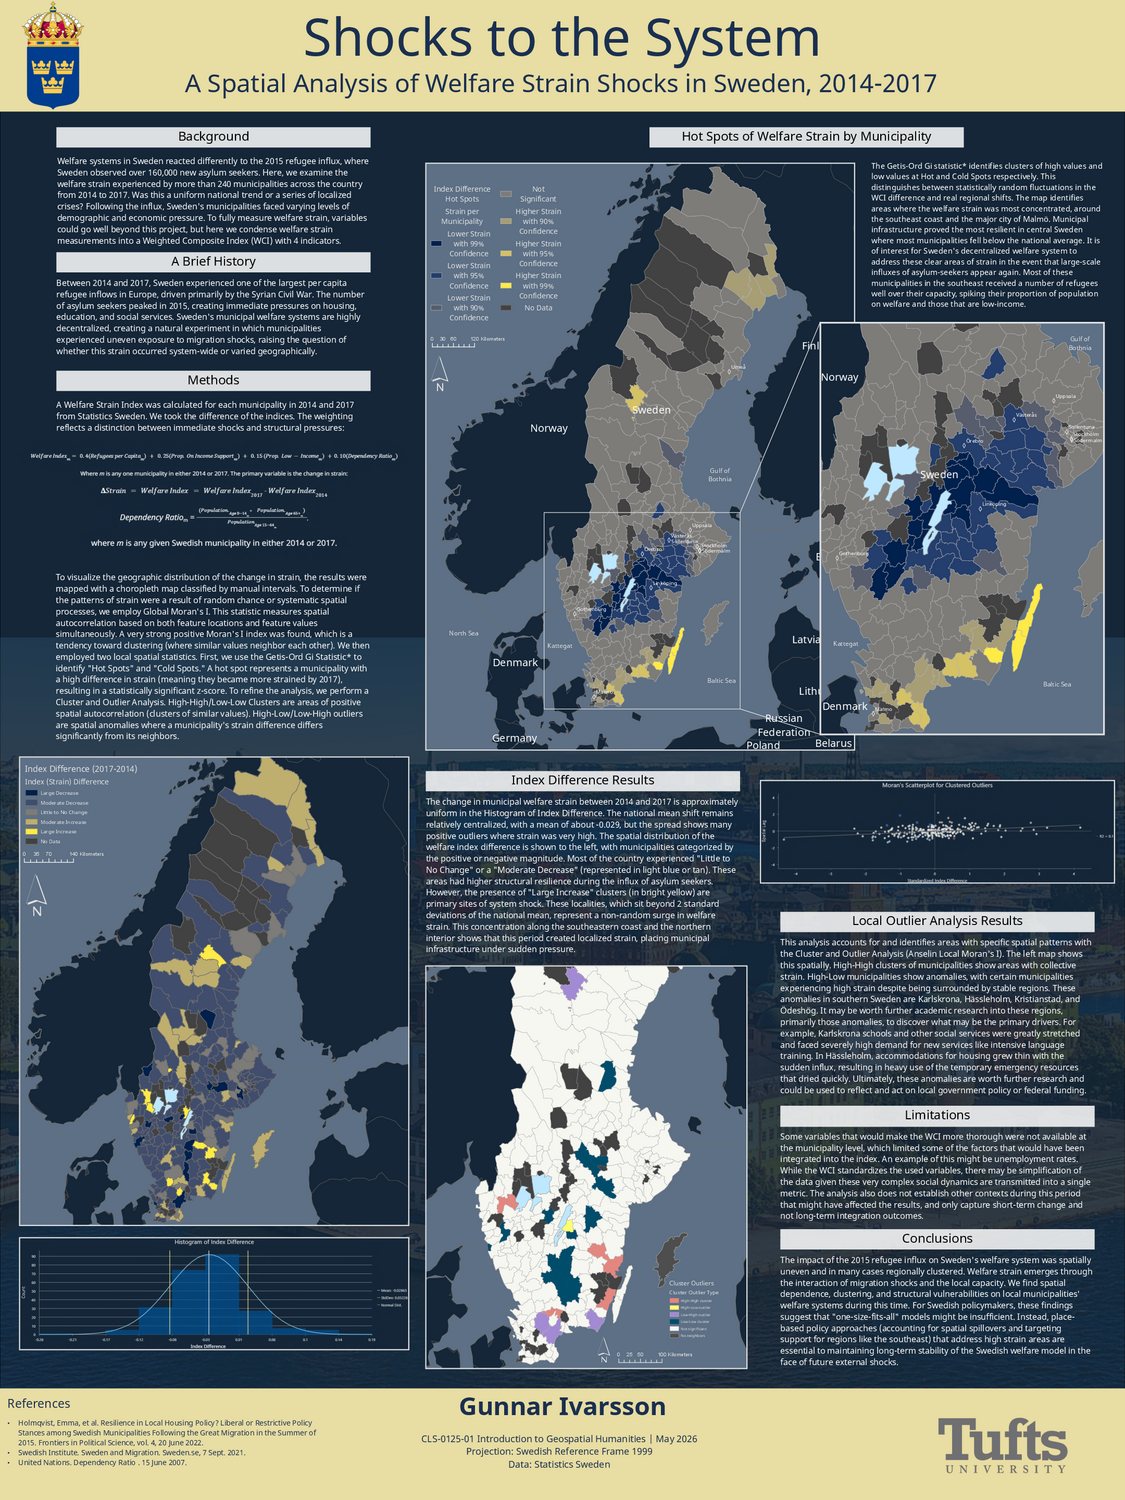
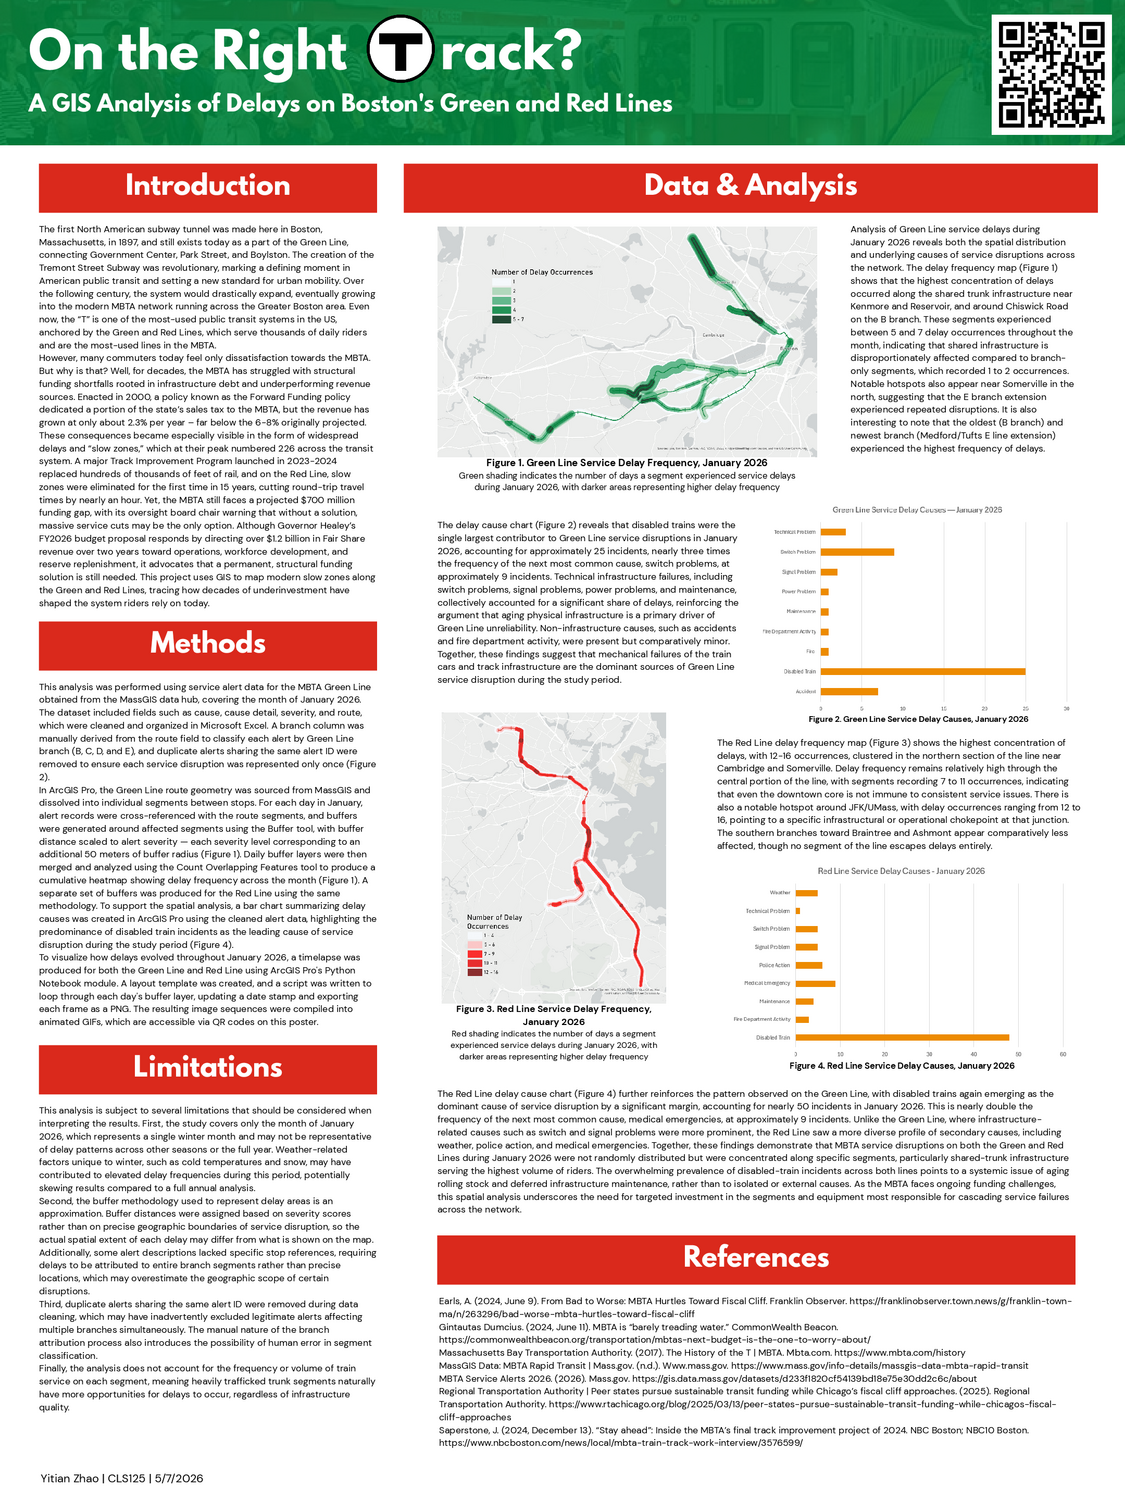
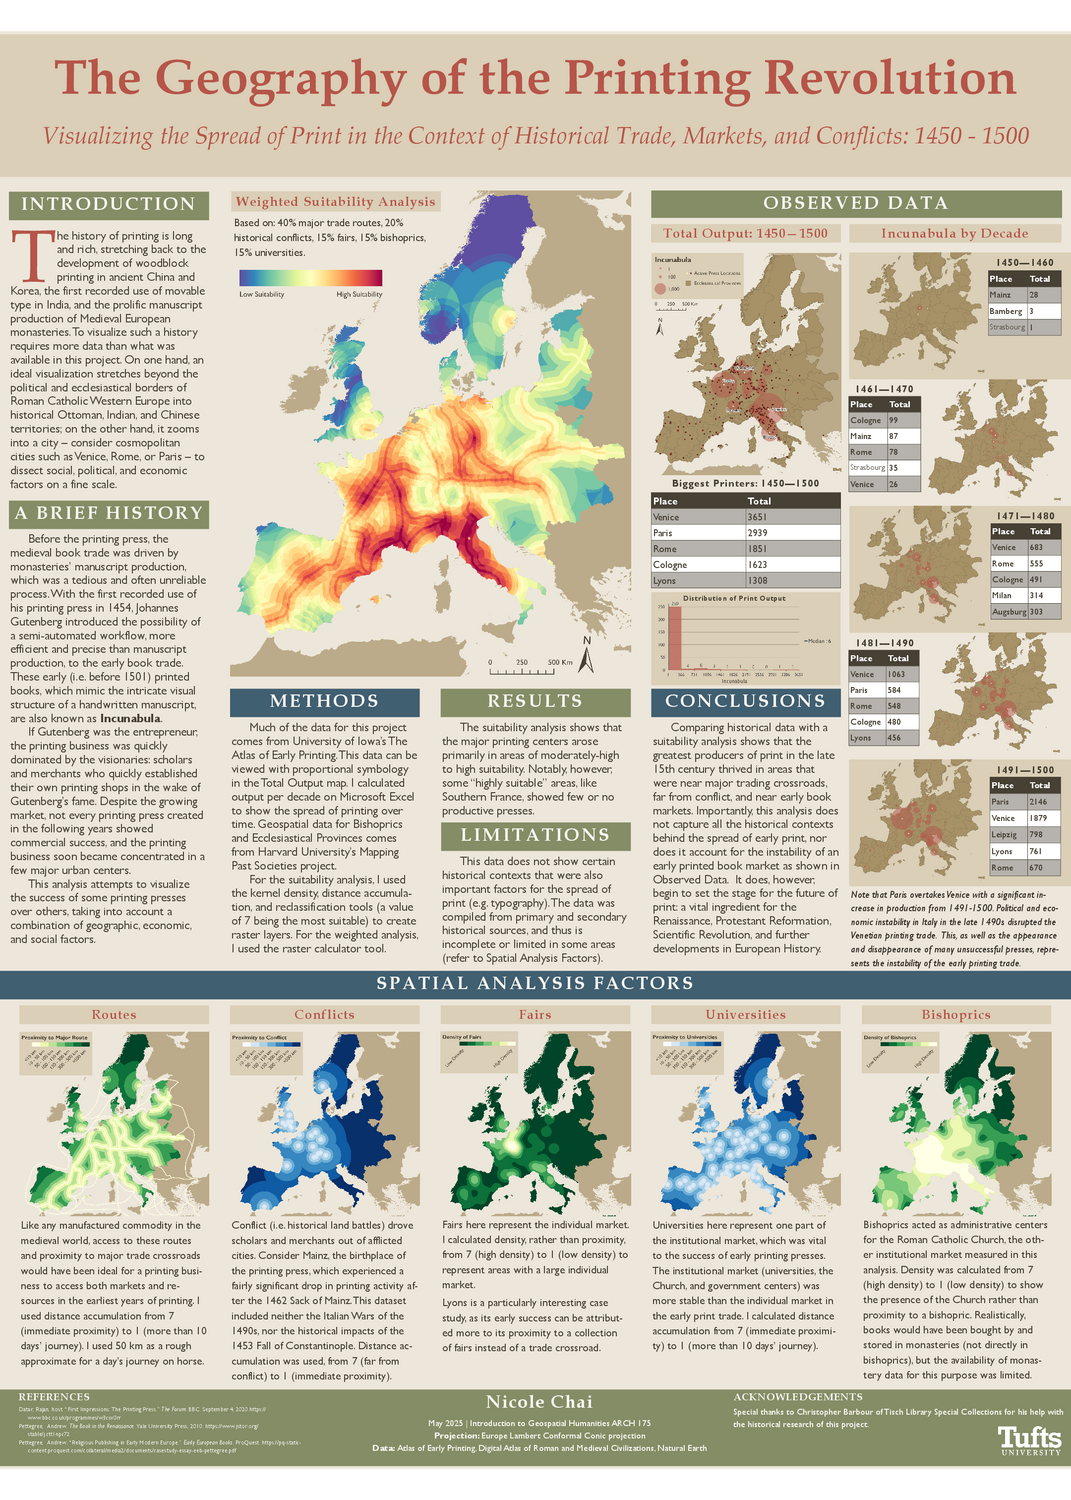
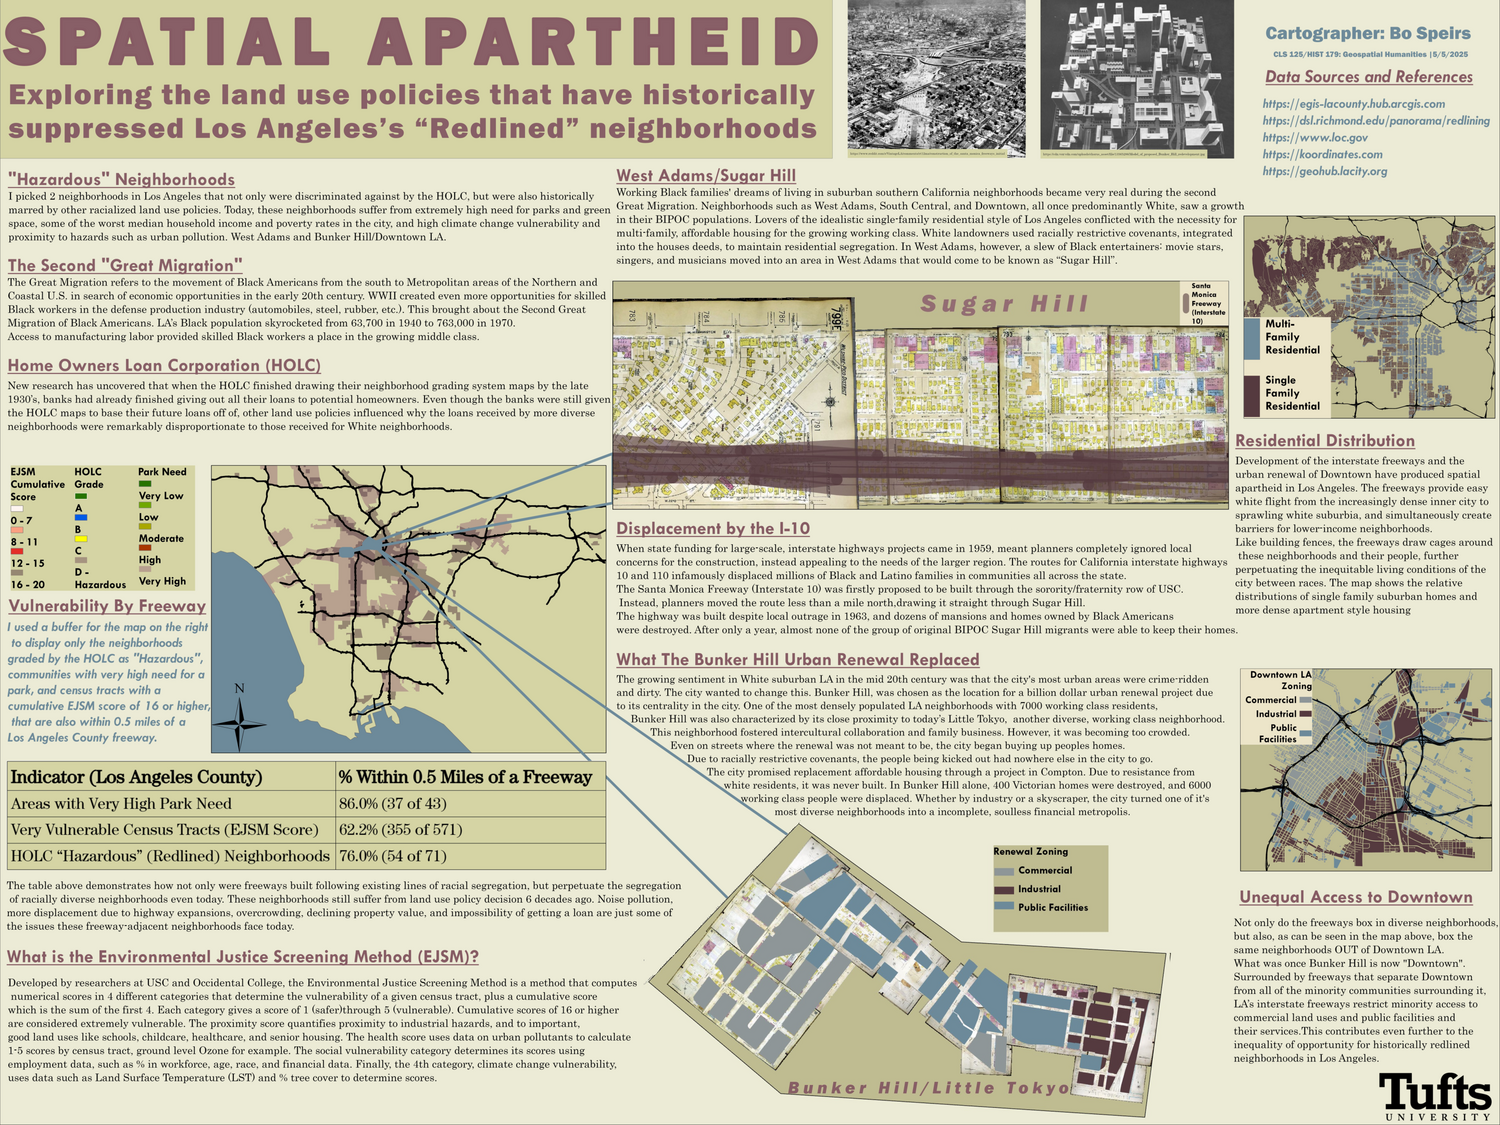
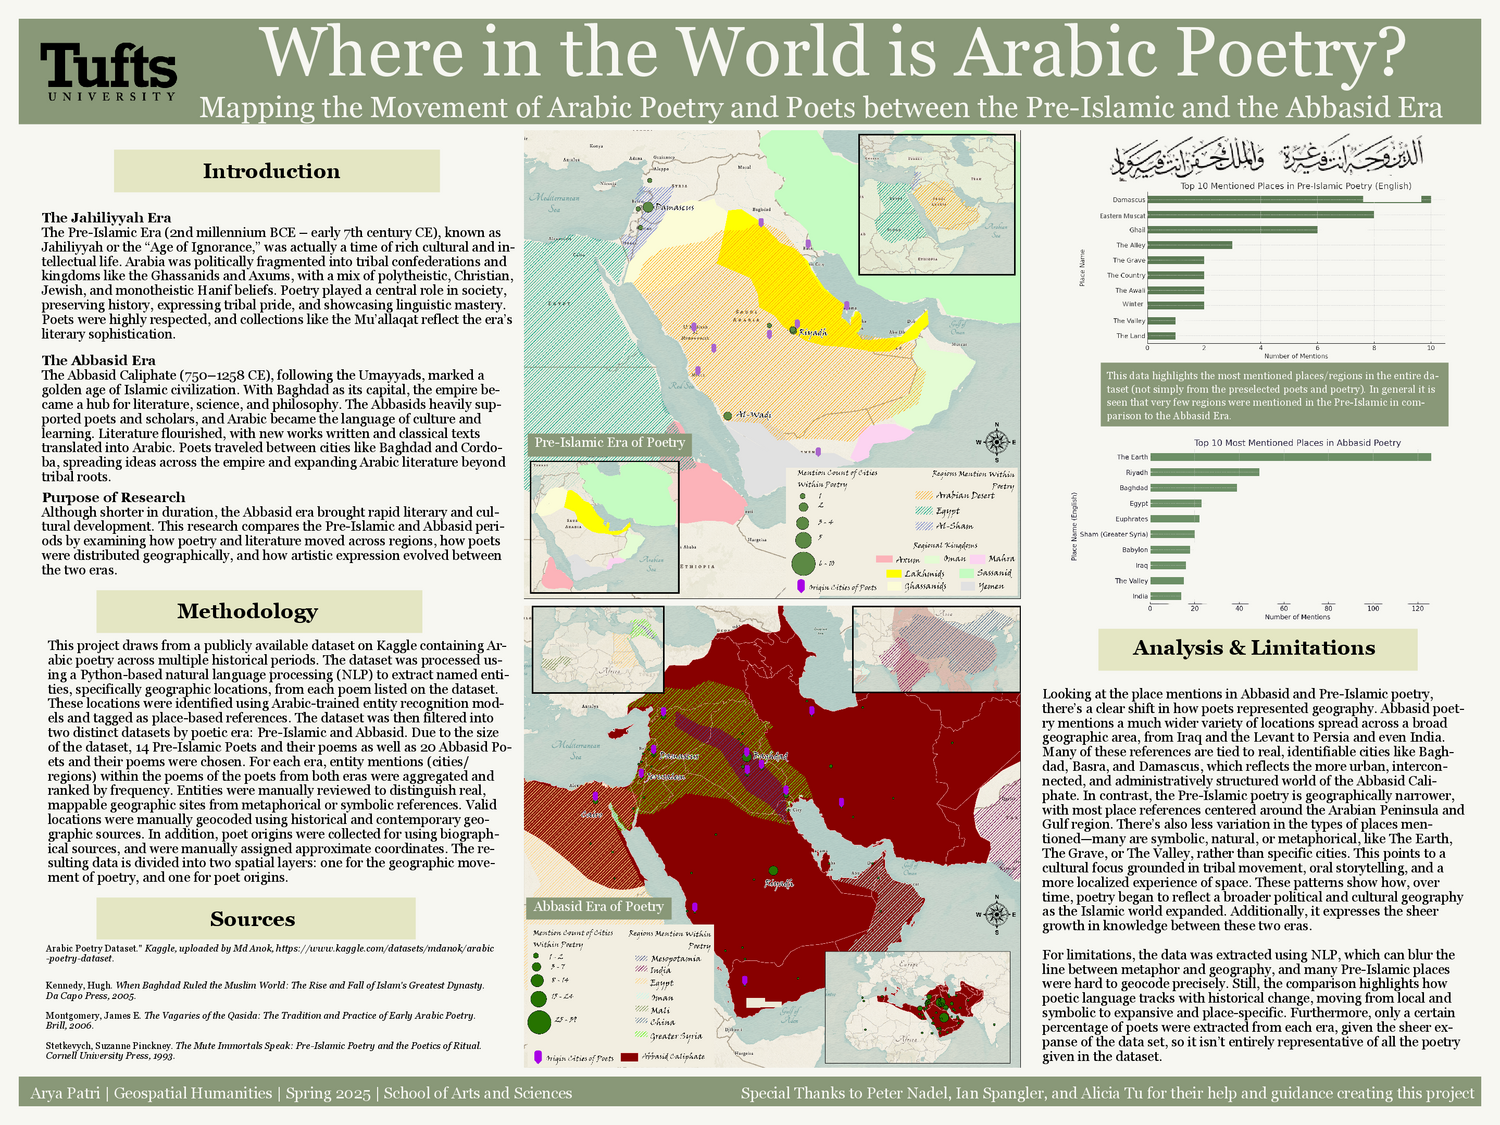
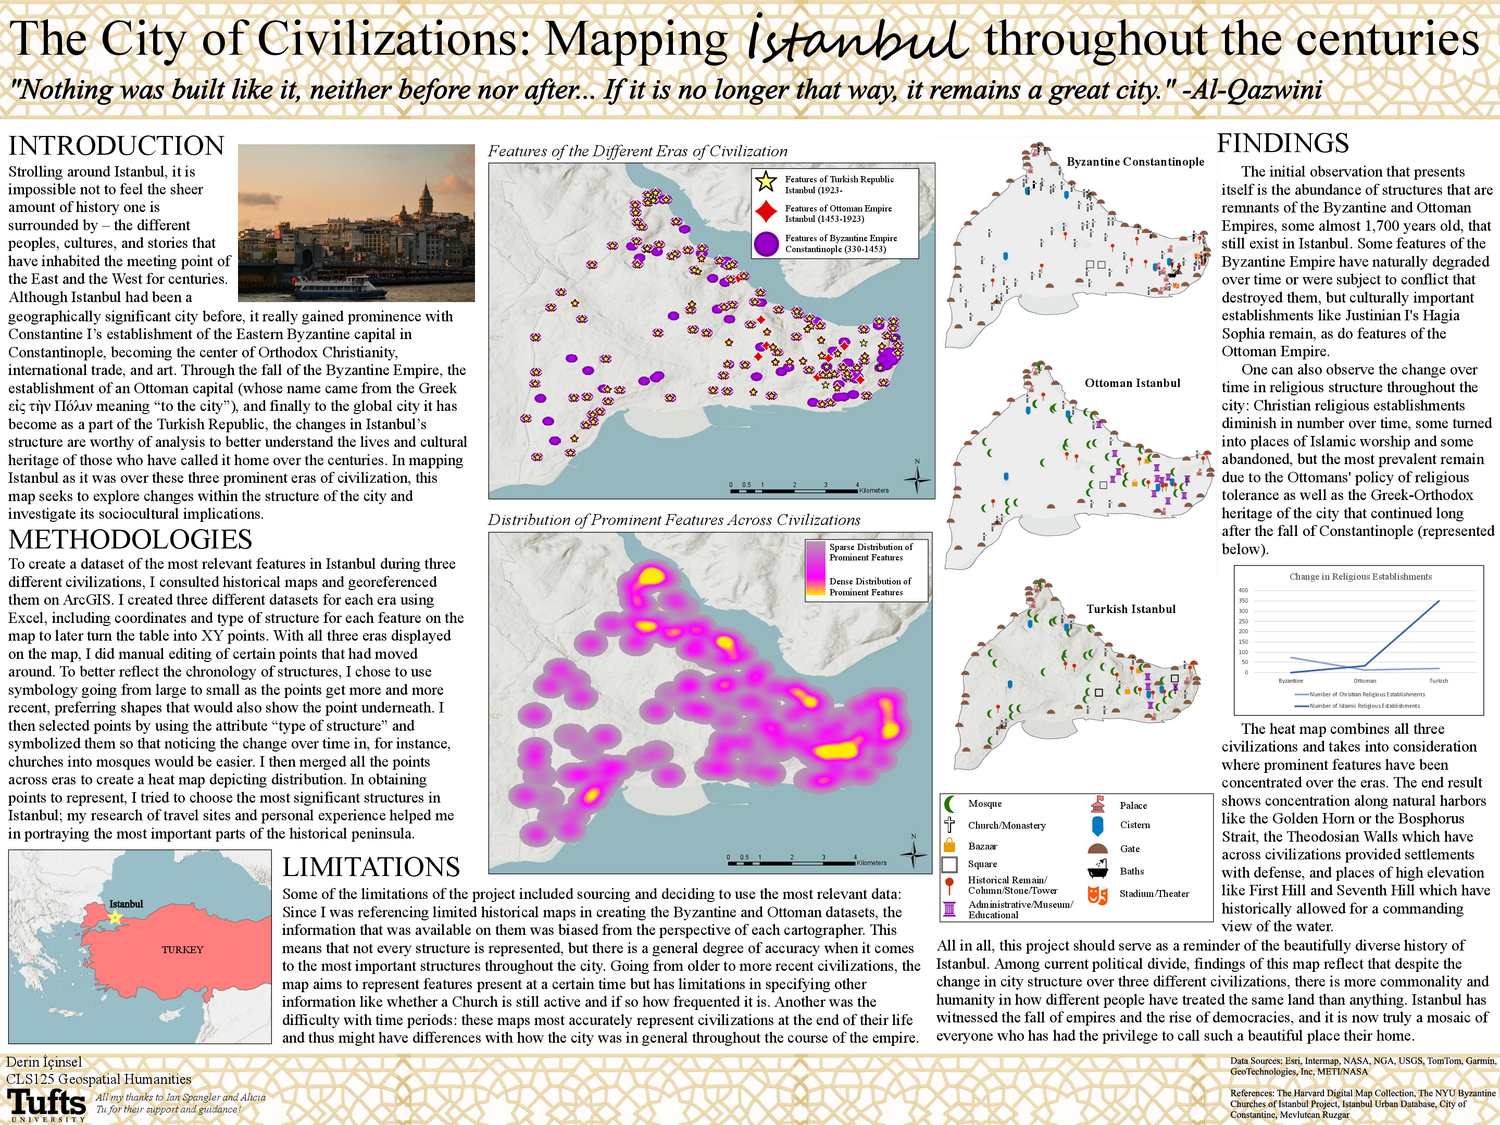
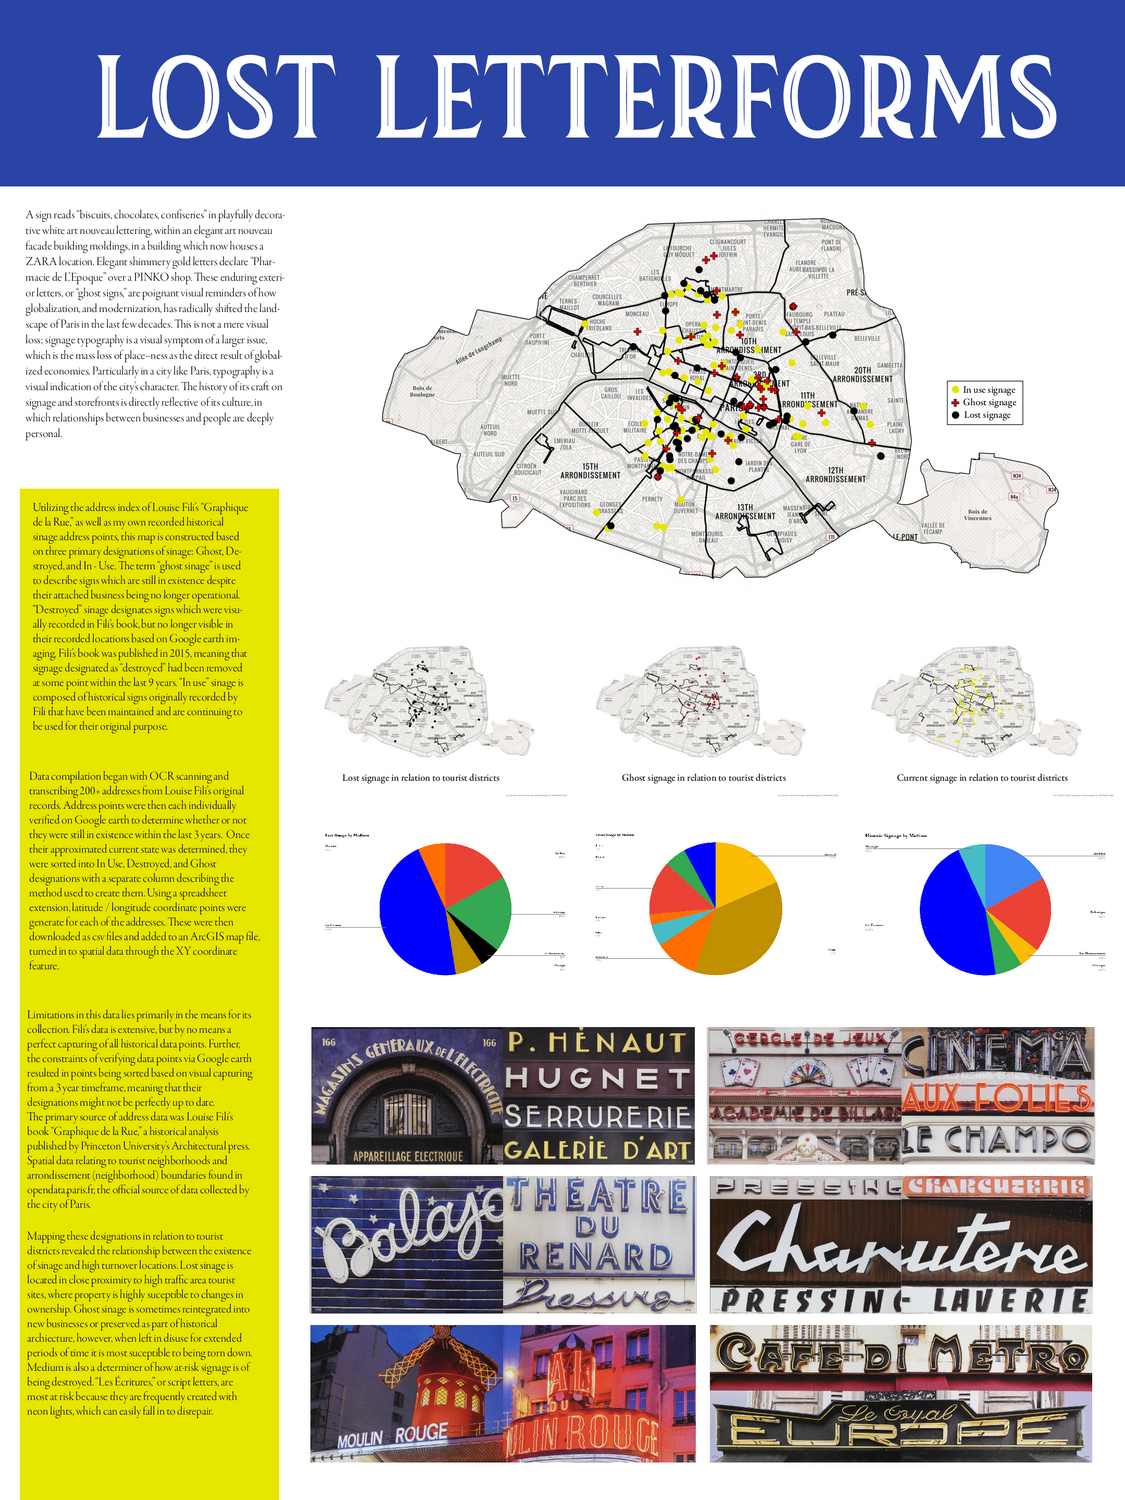
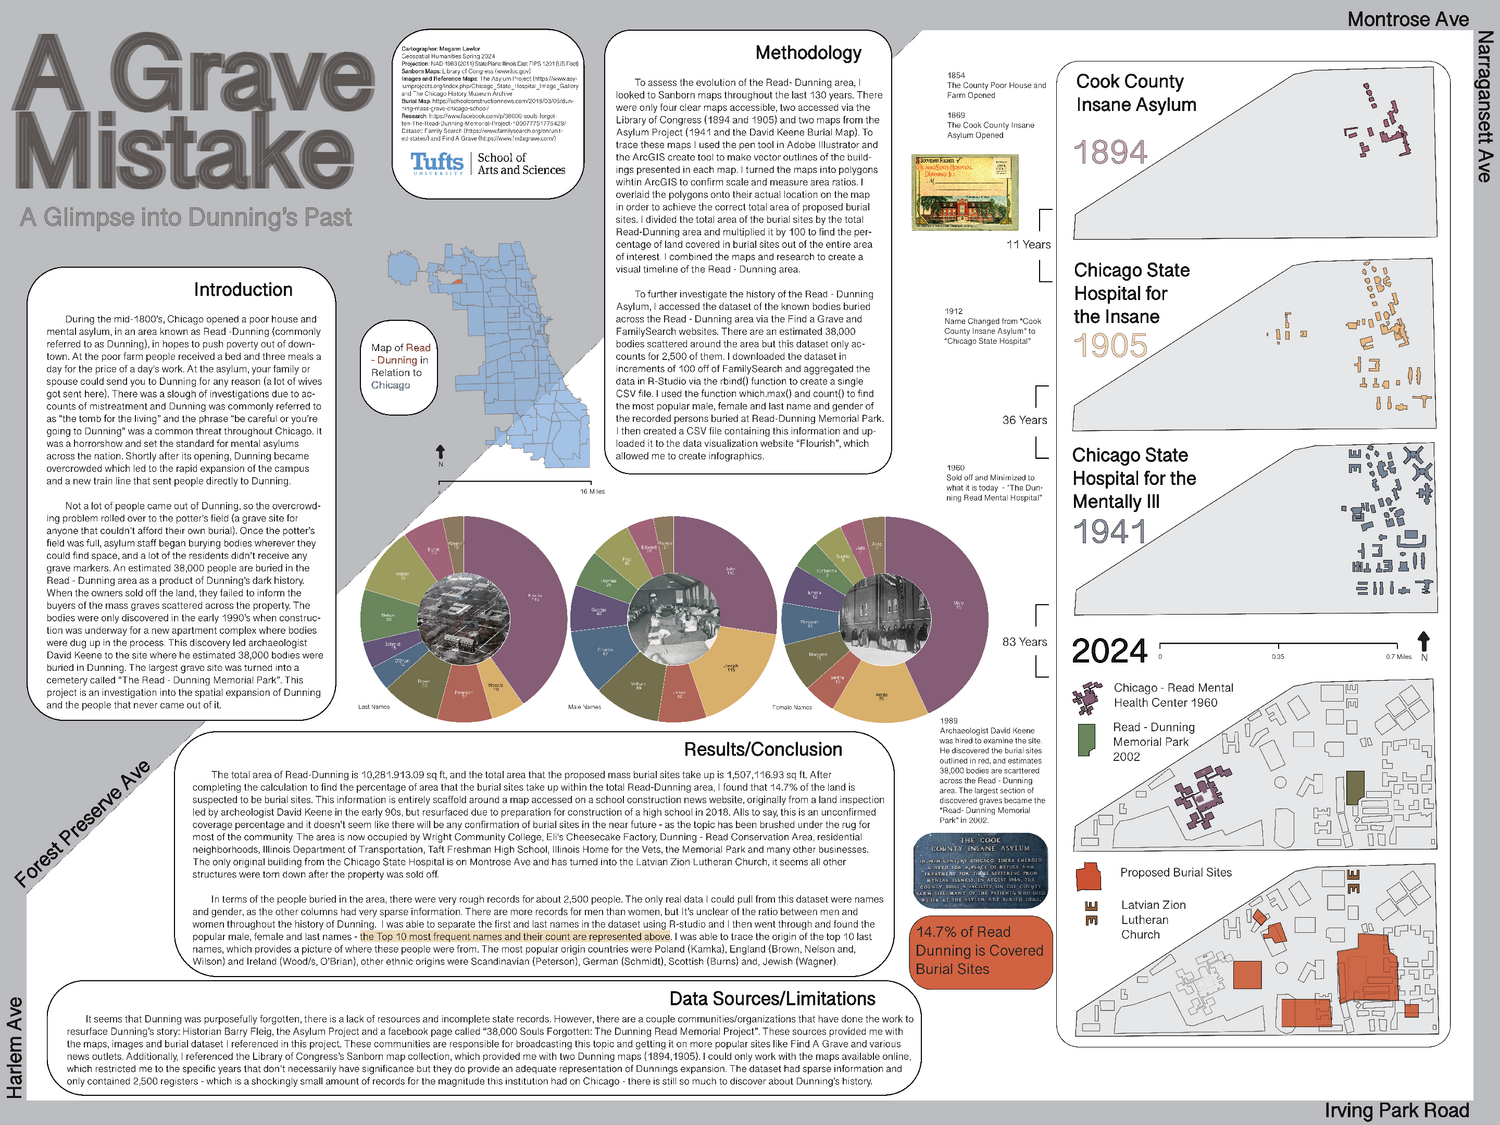
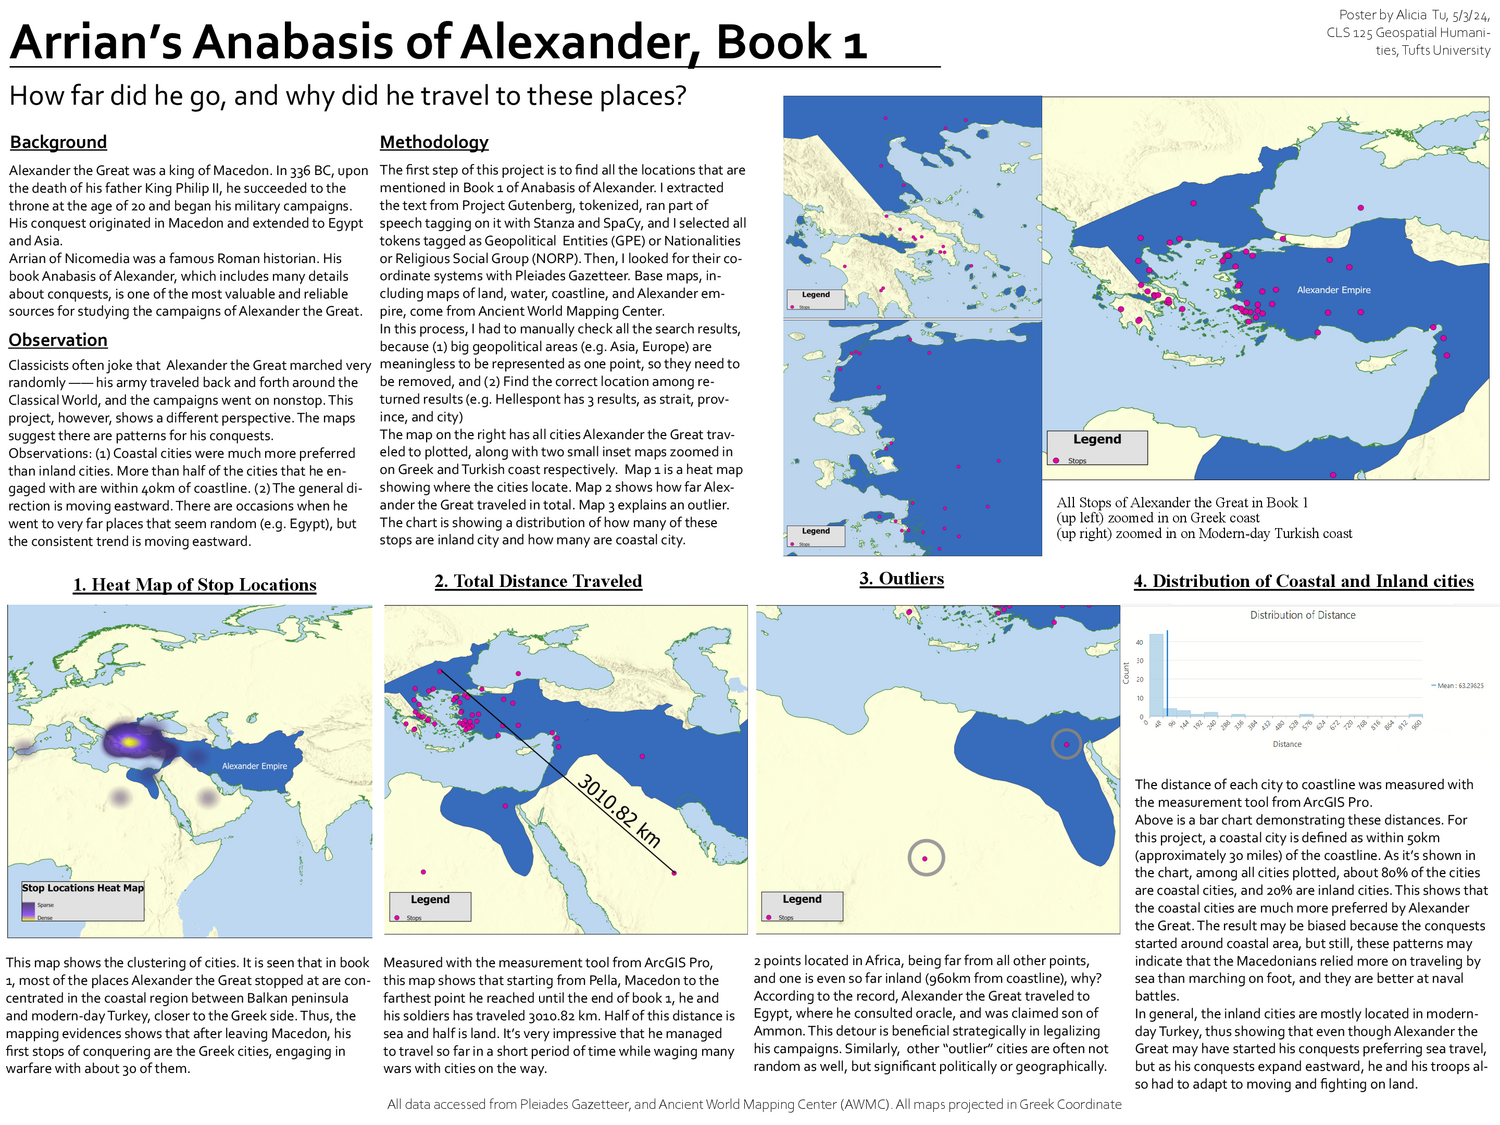
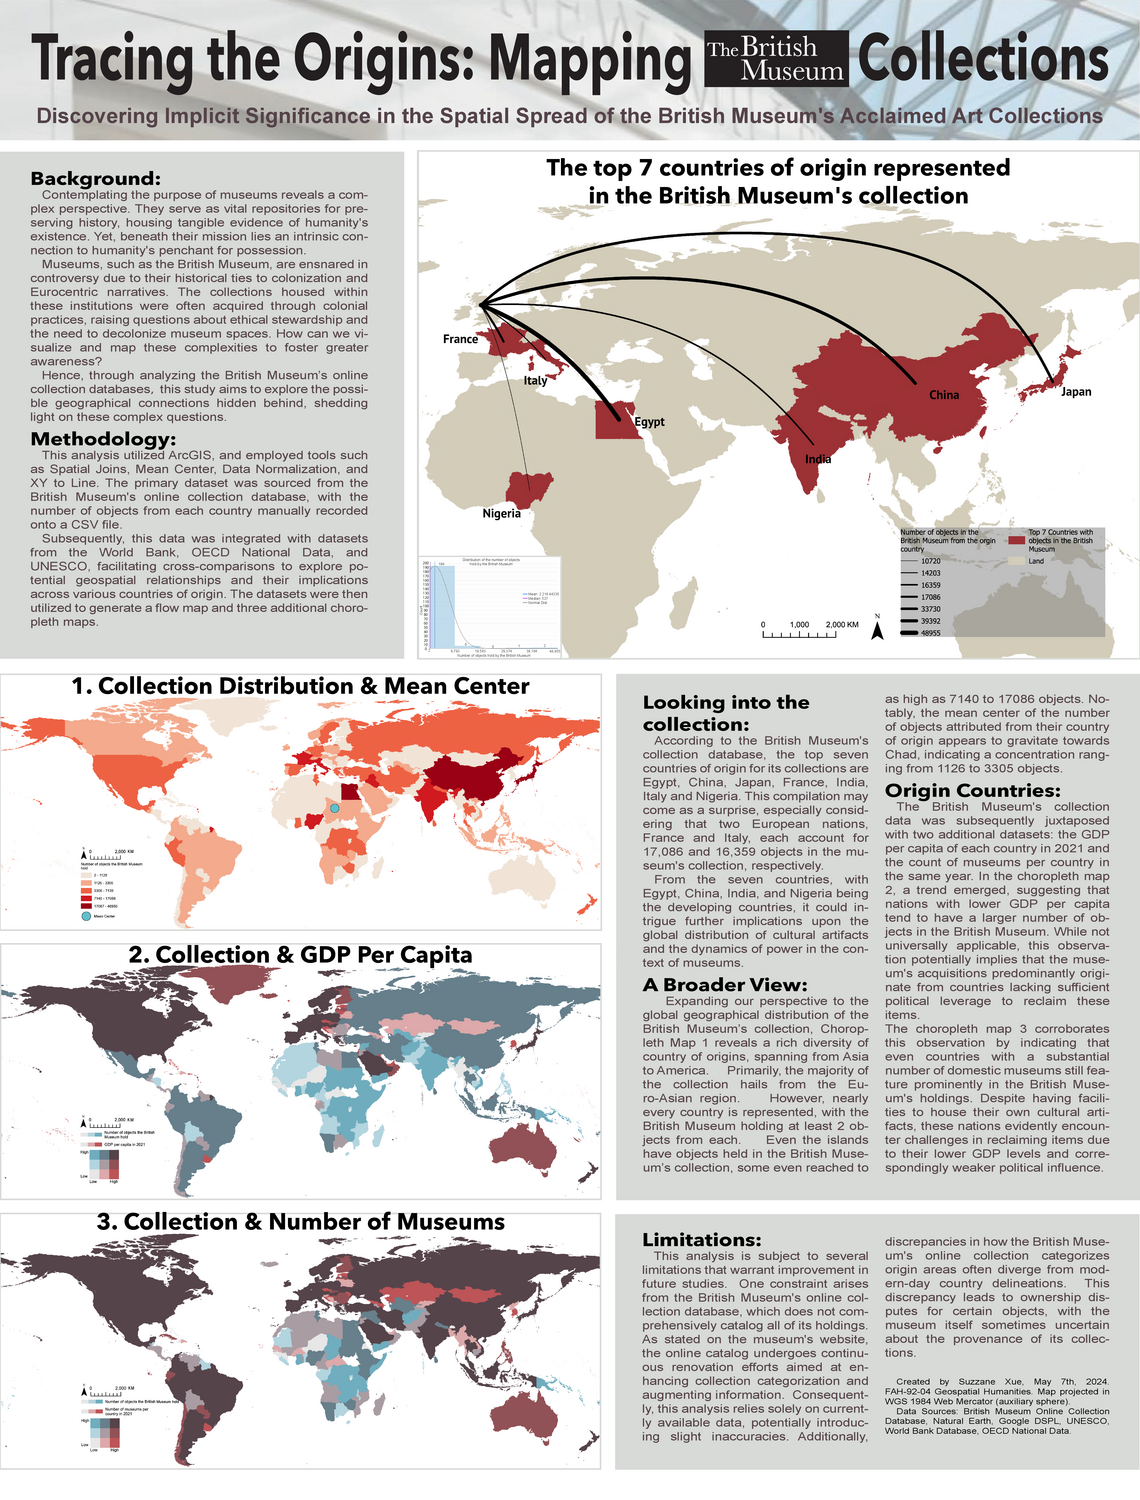
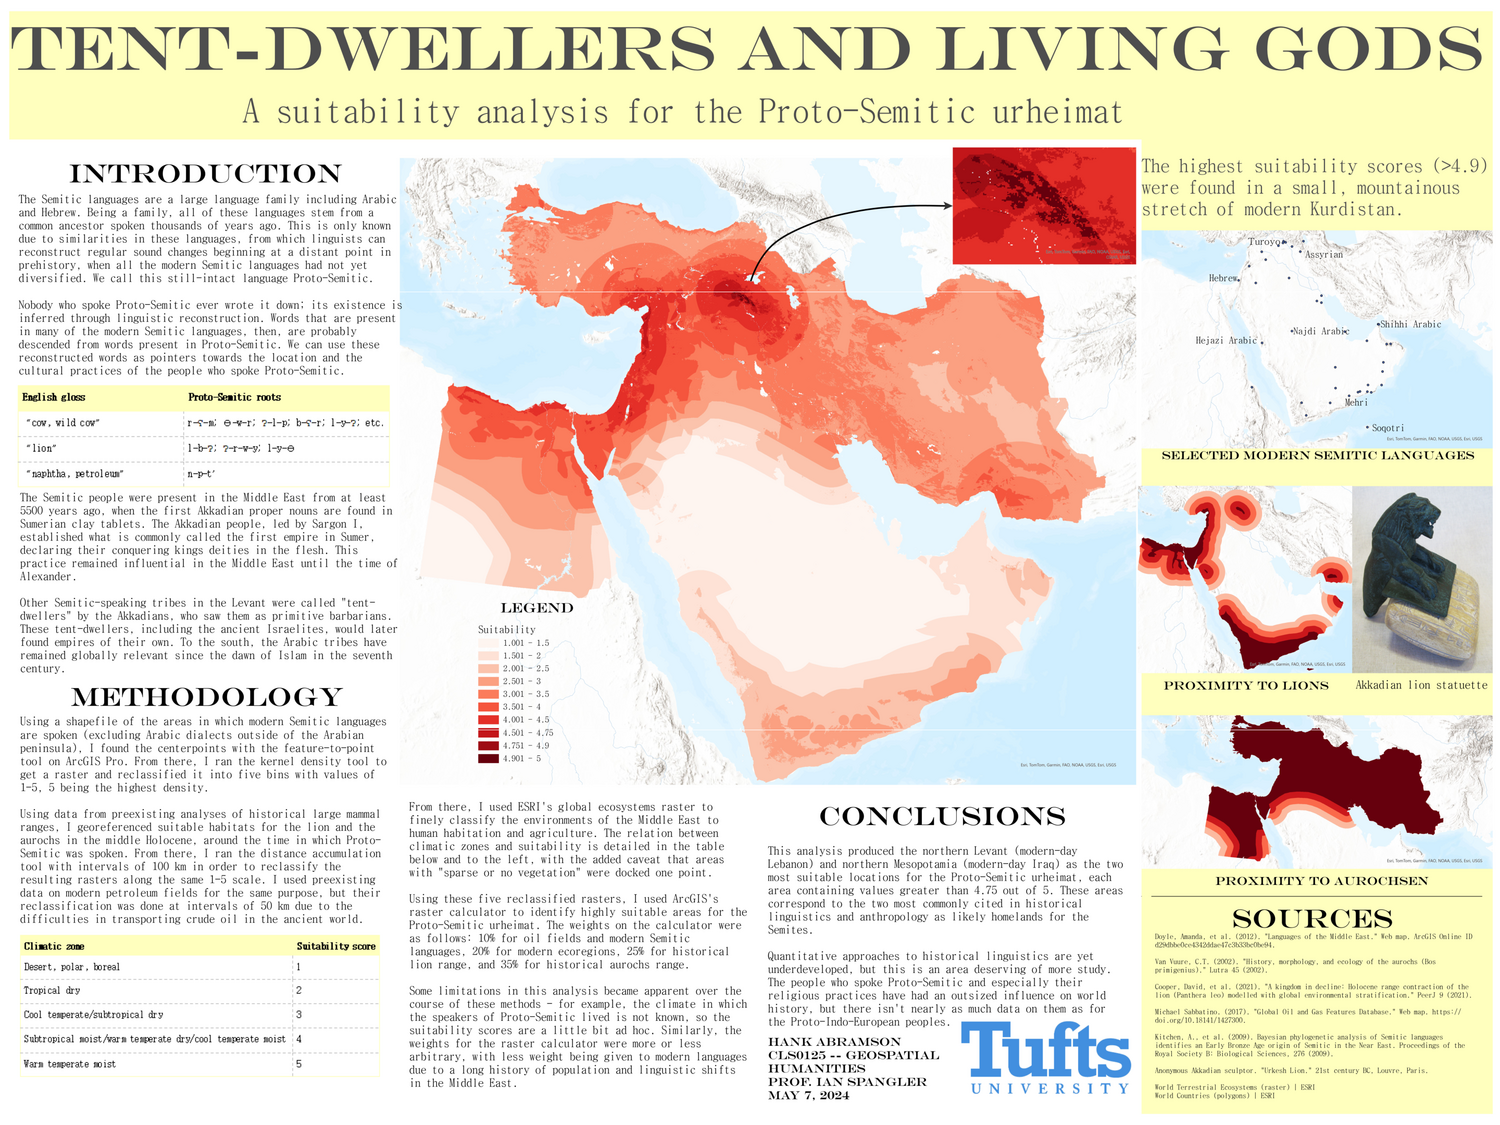
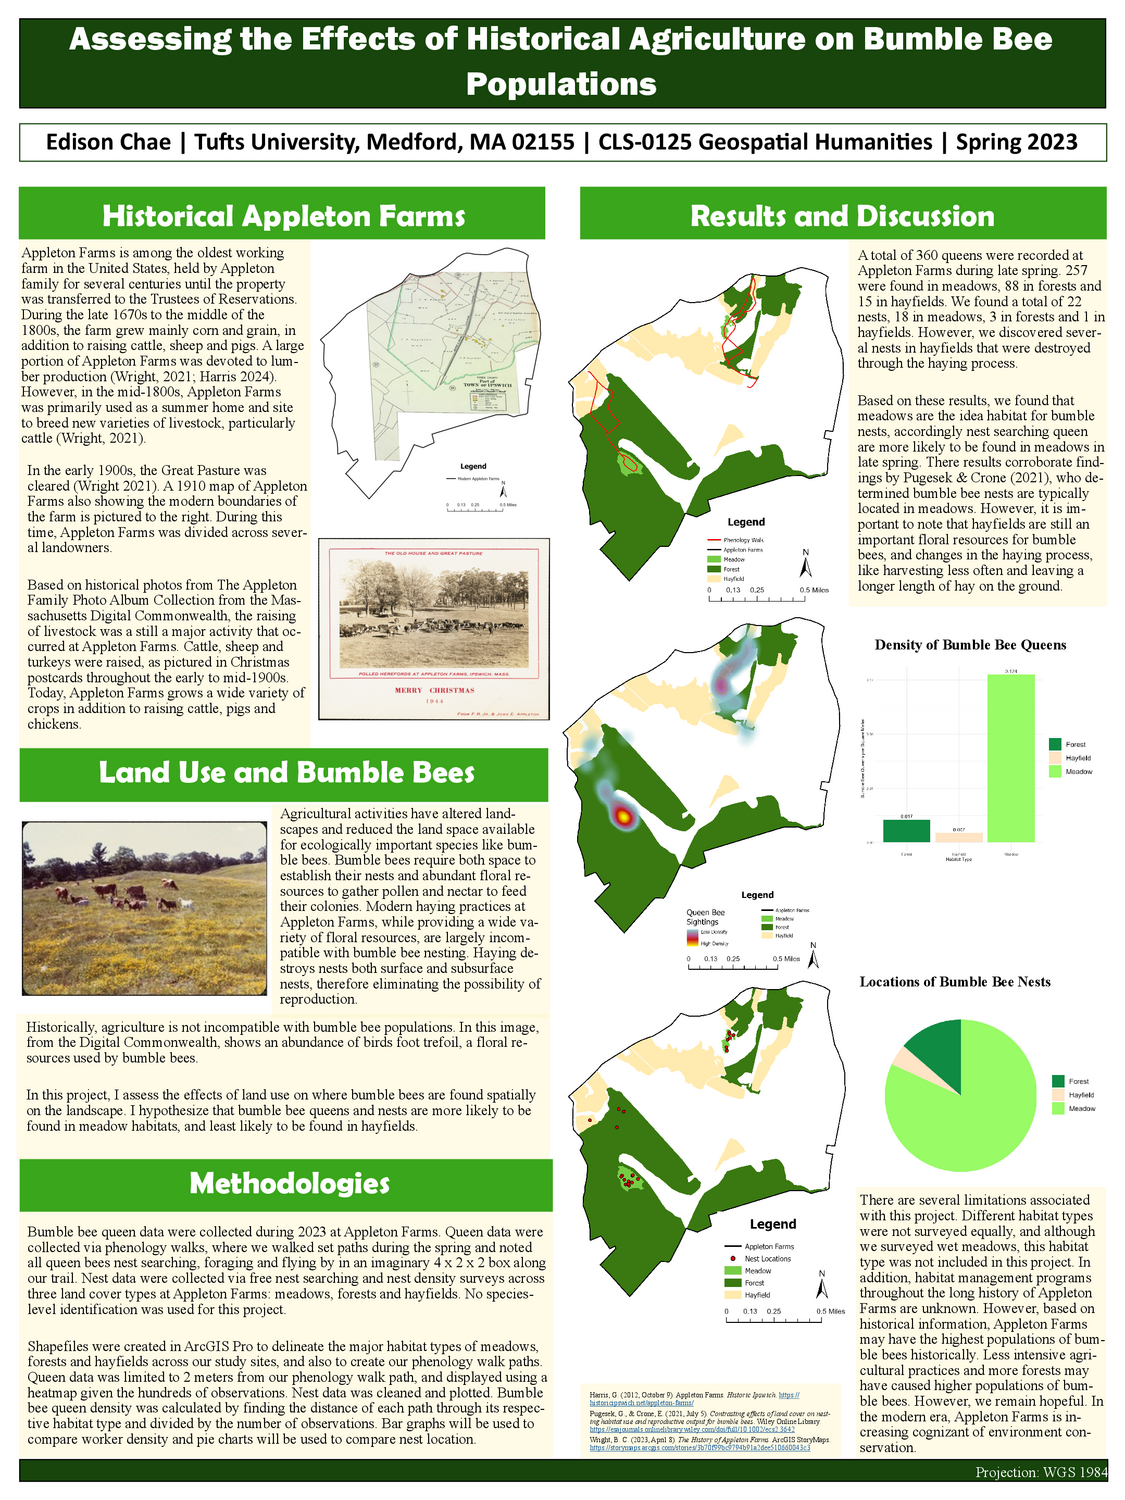
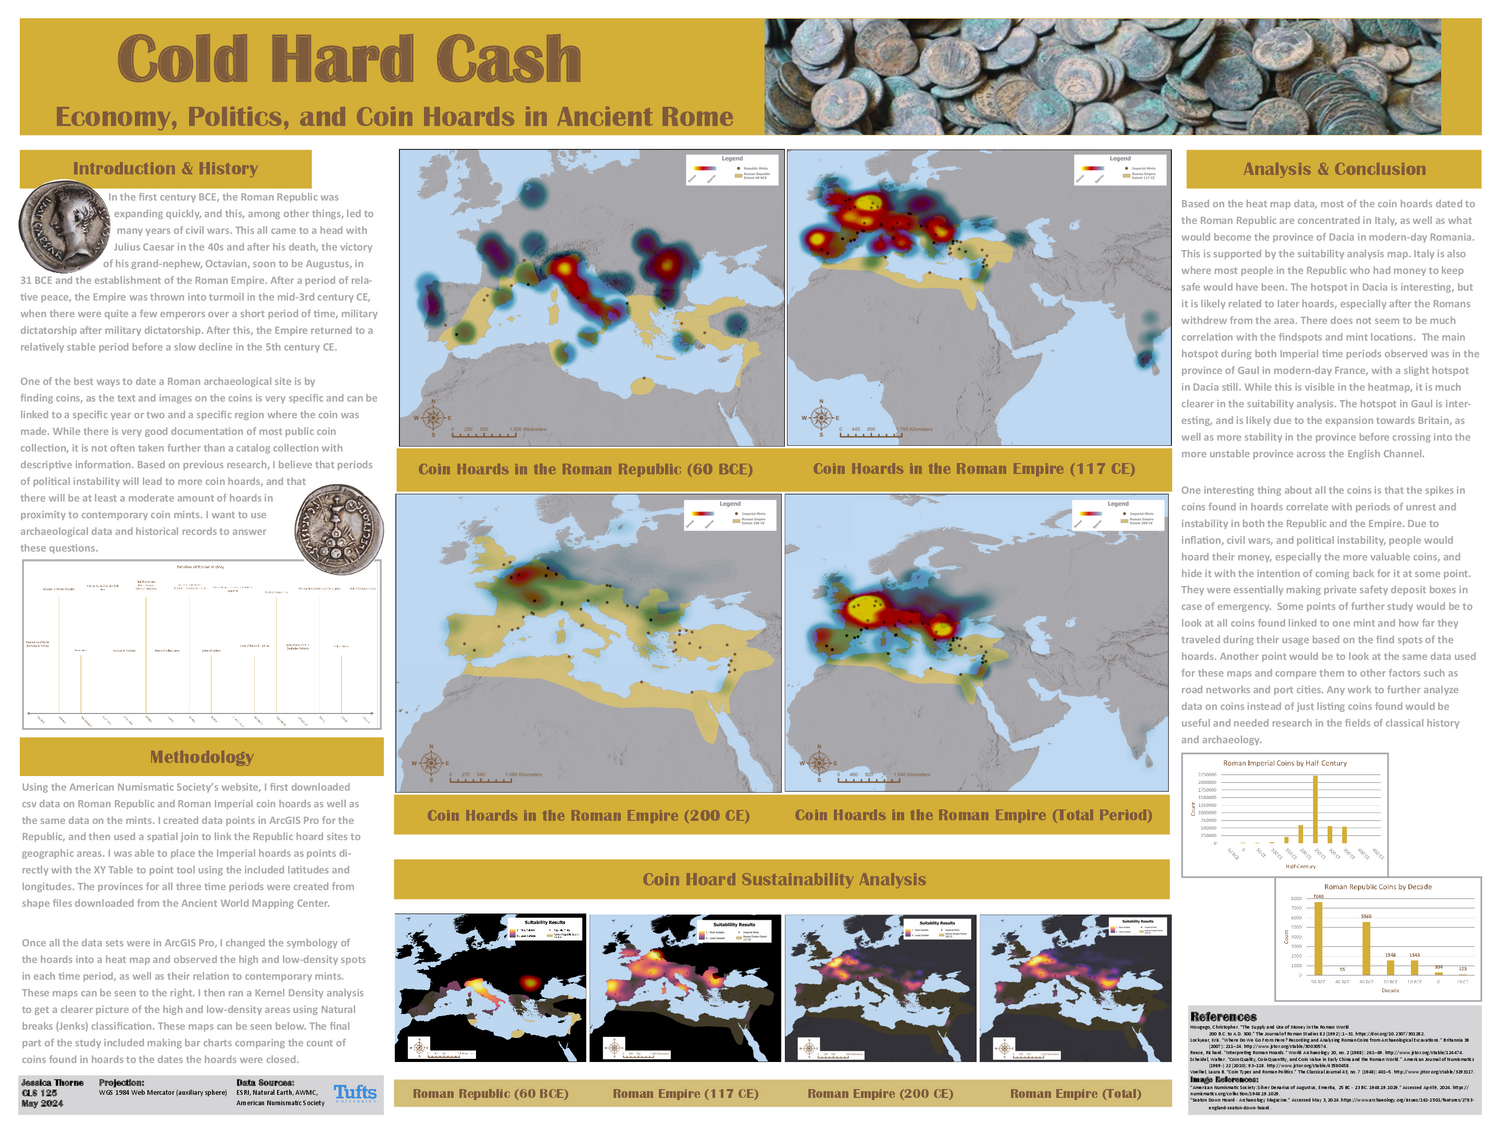
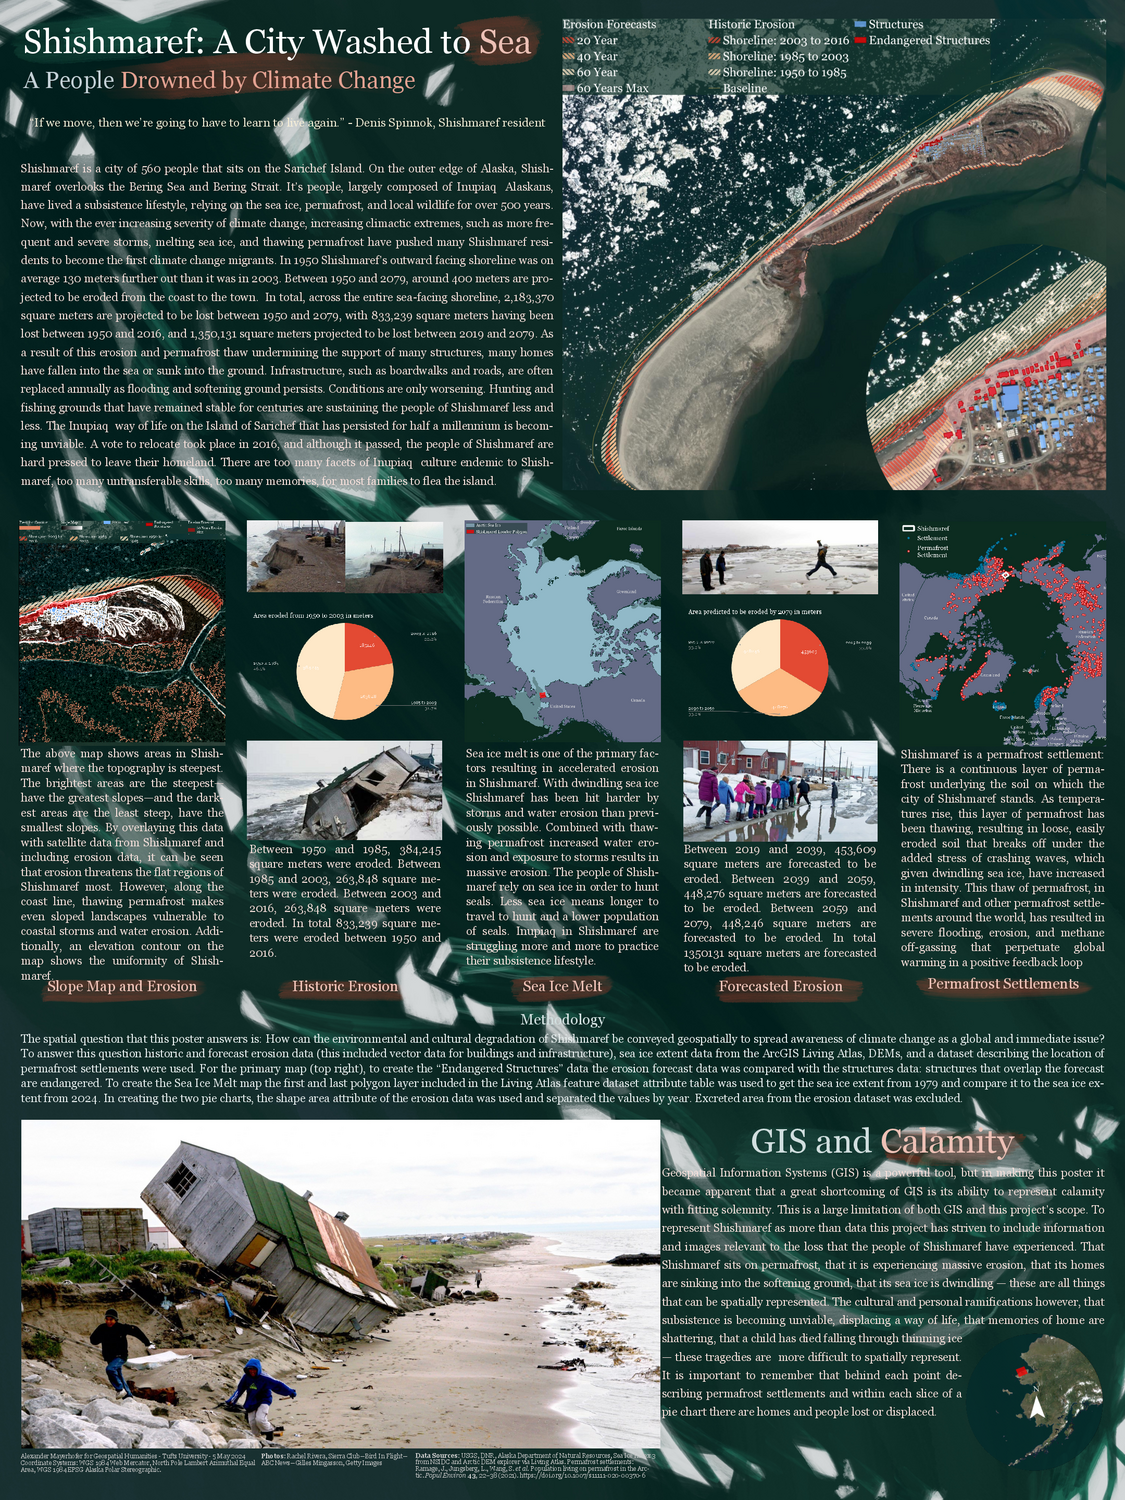
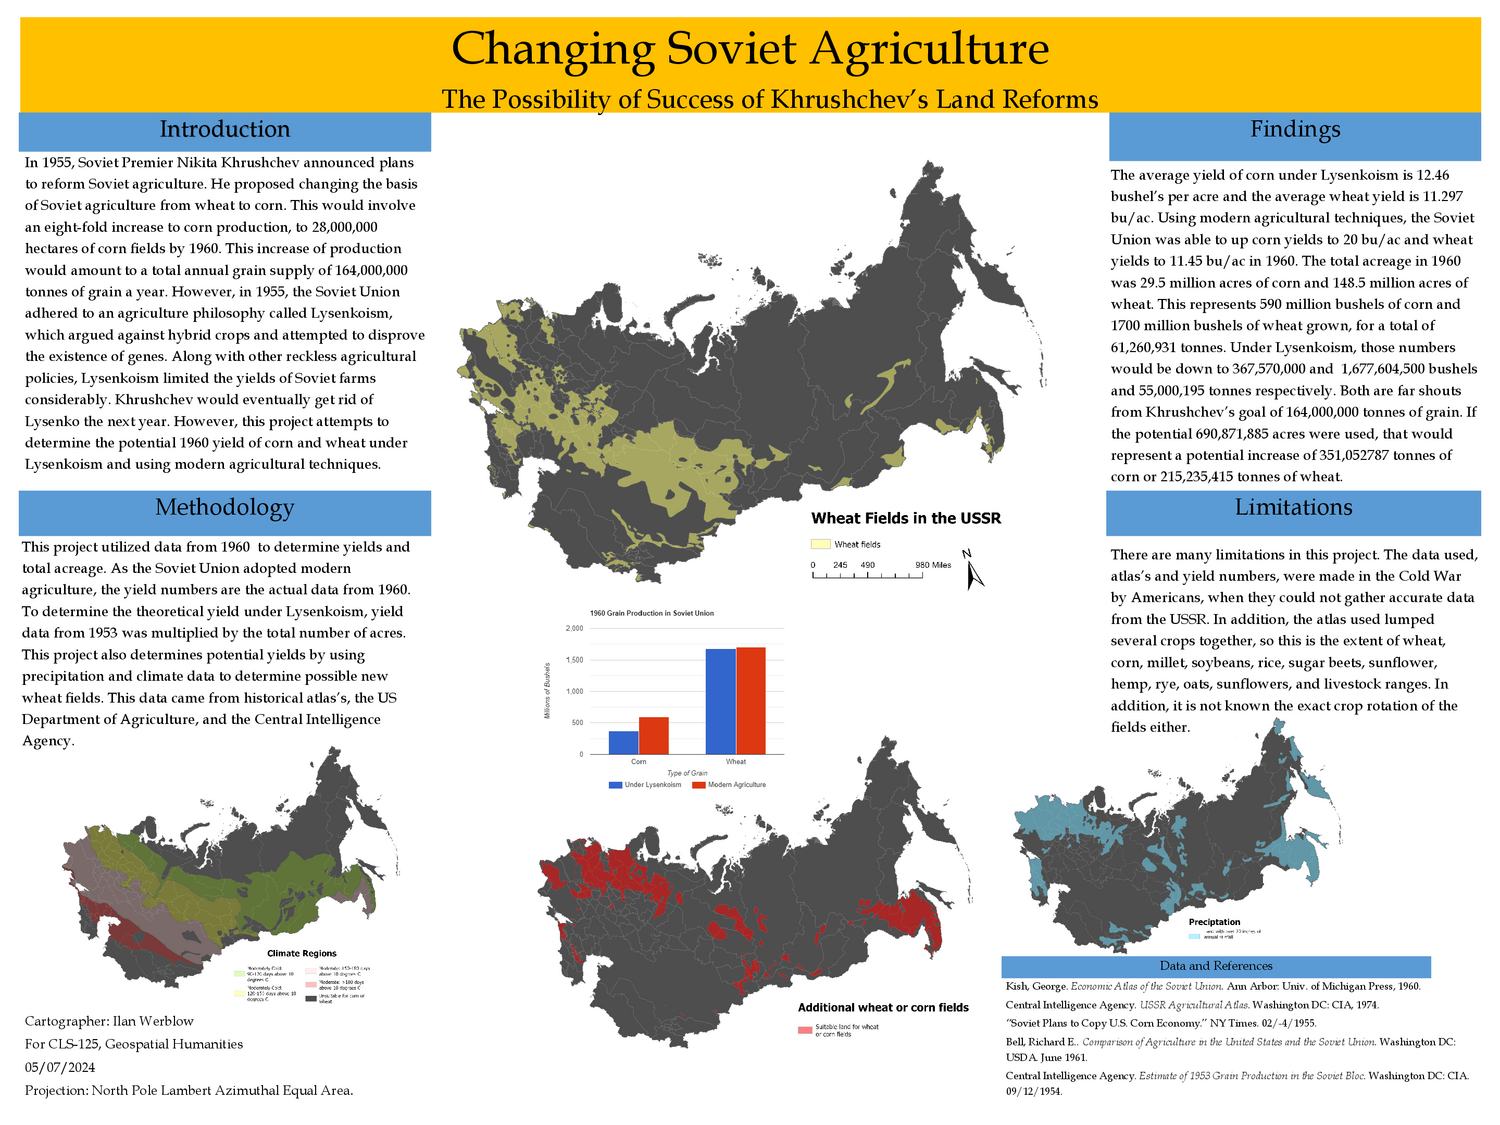
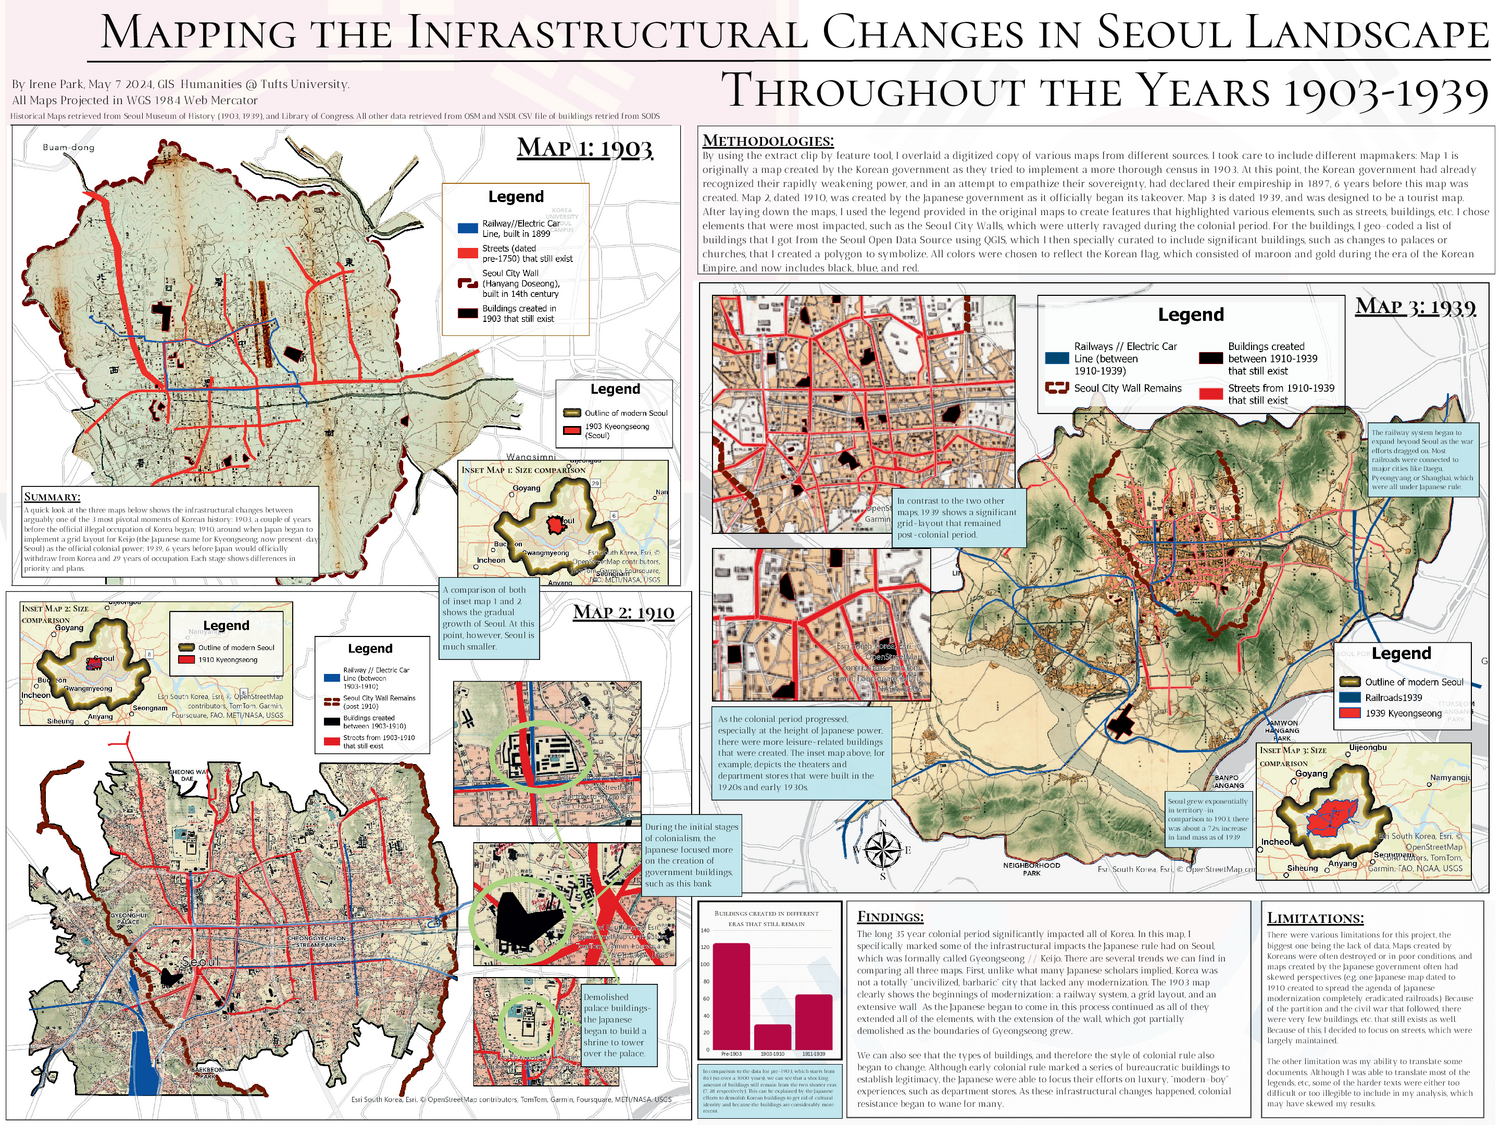
Here’s a sample of previous projects that I think came together really nicely (these have more of a “humanities” spin than your projects are required to have):
Conceptualize your project
I ask that you conceptualize your project in four different registers. I explain each below.
Topical register
The topical register of your project is the empirical content. Maybe you’re interested in housing discrimination in the early twentieth century United States; maybe you want to map invasive flora in Virginia’s Eastern Shore; or maybe you want to understand how digital ride-hailing apps change traffic patterns in highly urbanized places. Whatever you choose, I think of this topical register as the “what.”
Conceptual register
The conceptual register of your project is what hooks the empirical content into a theoretical framework. This is your project’s “so what.” What is your theory of housing, home, and discrimination? What can we learn from the spread of invasive plants? Why does it matter to visualize how Uber or Lyft or Didi impact traffic? You should be able to explain the conceptual contribution of your project, and just as importantly, situate it within a wider intellectual history.
Technical register
The technical register describes your methodology: in other words, the “how.” What datasets did you use? Vector, raster, both, other? How much should we trust the data and your analysis of it? Did you make the data yourself, or did you find it somewhere? What kinds of tools and workflows did you use? Why did you select those ones?
Graphical register
The graphical register refers to how you choose to display your final product. Let’s call this the “whoa!” Your project should be informed by best practices of cartographic design, whether carefully followed or artfully transgressed. Design should always be in service of your overall argument; keep this in mind each step of the way as you lay out your final project.
Requirements
Whether you choose a traditional large-format inforgraphic or a more unconventional, creative work, your final project must include the following combination of text, maps, and graphics.
Text
Text must include discussion of:
- your main spatial research question/s & themes
- methodology/ies & workflow
- findings/observations
- limitations in your analysis
- data sources
Maps
Maps must include:
- a primary map that shows key parts of your analysis
- at least one other map to provide additional context
Graphics
Graphics could include:
- 1-2 non-cartographic summaries of the data you used
- this could be a bar chart, scatter plot, or summary table